Powerful CRM Dashboards
Multiple customizable dashboards with real-time widgets. Lead, Call, Meeting, Quotation, Sales, and Target dashboards - all in one place.
Explore Our Dashboards
Six powerful dashboards with multiple widgets each, fully customizable to meet your business needs.
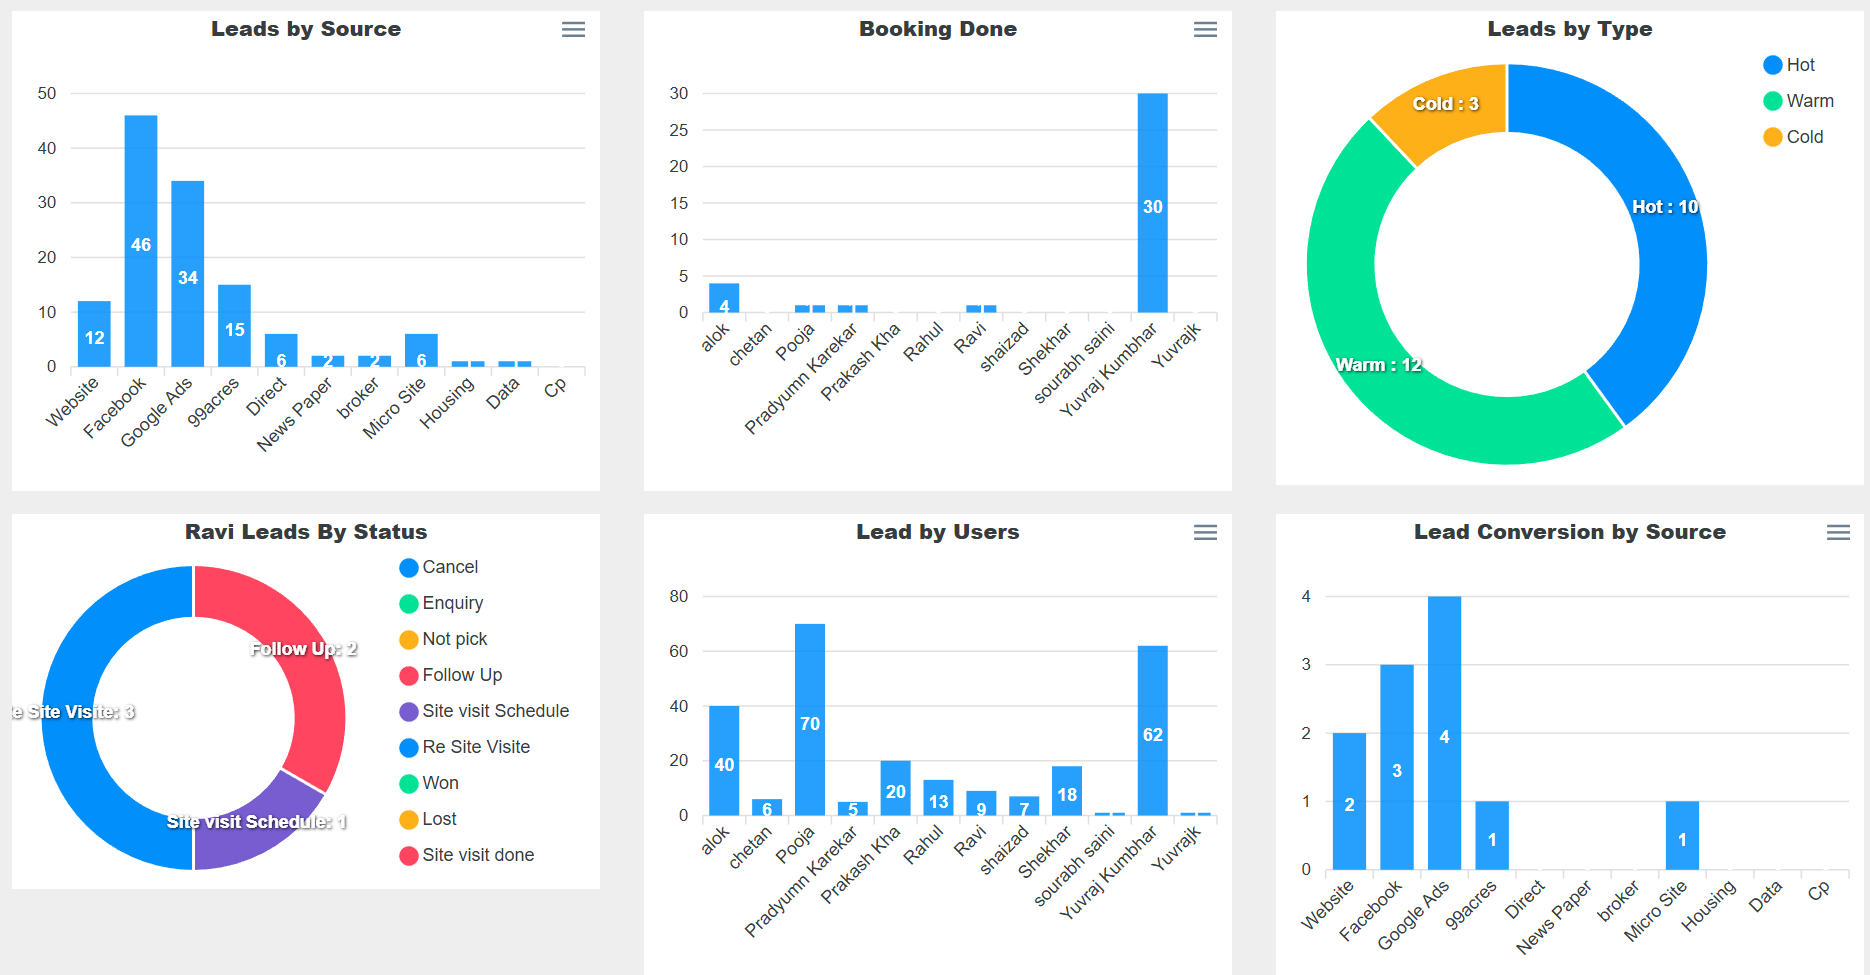
Lead Dashboard
Complete overview of all your leads with status tracking, source analysis, and conversion metrics.
Leads by Status
Understand lead stats and metrics in pie chart format with percentage breakdown of each lead status.
Leads by Source
Get an overview of all lead sources with count of leads generated from each channel respectively.
Leads by Industry
Analyze your target audience and demographics by category or industry at your fingertips.
Lead Funnel
Visualize the lead journey with customizable stages. Funnel auto-generates based on your data input.
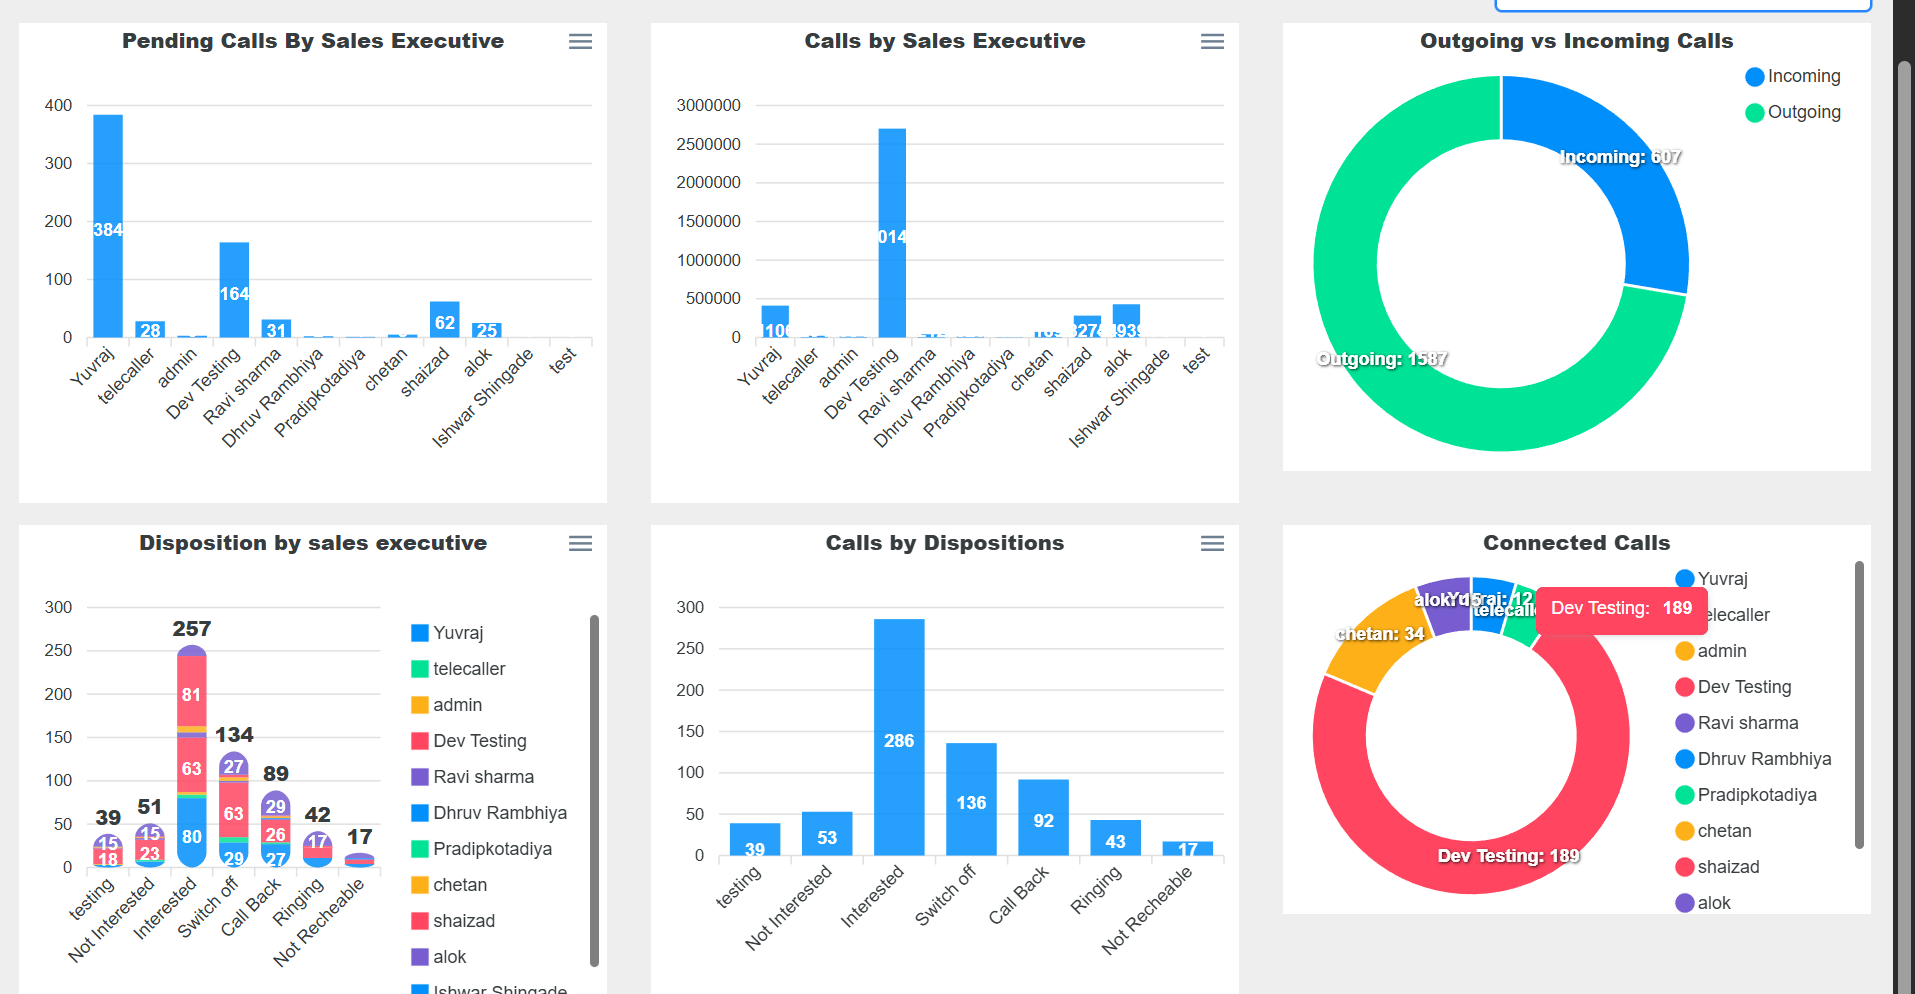
Call Dashboard
Track all call activities, duration analytics, and team performance metrics in real-time.
Call Volume Analytics
Monitor total calls made, received, and missed with hourly and daily breakdowns.
Call Duration Metrics
Analyze average call duration, longest calls, and time spent per lead category.
Agent Performance
Compare call performance across team members with leaderboards and efficiency scores.
Call Outcomes
Track call dispositions, follow-up requirements, and conversion rates from calls.
Meeting Dashboard
Manage and analyze all meetings, site visits, and client interactions efficiently.
Meeting Schedule
Calendar view of all scheduled meetings with attendee details and agenda tracking.
Meeting Outcomes
Track meeting results, action items, and follow-up tasks with status updates.
Site Visit Tracker
Monitor client site visits with location data, duration, and feedback collection.
Client Engagement
Measure meeting frequency per client and engagement scores over time.
Quotation Dashboard
Track all quotations, proposals, and pricing analytics with approval workflows.
Quotation Pipeline
Visual pipeline of all quotations from draft to approved with value tracking.
Win/Loss Analysis
Analyze quotation success rates, reasons for rejection, and competitive insights.
Revenue Forecast
Project potential revenue from pending quotations with probability weighting.
Discount Analytics
Monitor discount patterns, margin analysis, and pricing optimization insights.
Sales Dashboard
Complete sales performance overview with revenue tracking and team analytics.
Revenue Overview
Track total revenue, monthly trends, and year-over-year growth comparisons.
Sales Pipeline
Visual representation of deals across stages with conversion rate analysis.
Team Leaderboard
Rank sales team members by performance with gamification elements.
Product Performance
Analyze best-selling products, categories, and revenue contribution breakdown.
Target Dashboard
Monitor targets, goals, and achievements across teams and individuals.
Target vs Achievement
Compare set targets against actual performance with visual progress indicators.
Goal Progress
Track individual and team goals with milestone markers and deadline alerts.
Performance Trends
Historical performance analysis with trend lines and seasonal patterns.
Incentive Tracker
Monitor bonus eligibility, commission calculations, and reward milestones.
Why Choose Our Analytics
Powerful features that help you make data-driven decisions
Real-Time Insights
Get instant access to your business metrics with live data updates across all dashboards.
Custom Widgets
Build your own dashboard layout with drag-and-drop widgets tailored to your needs.
Export & Share
Download reports in multiple formats and share insights with your team instantly.
Automated Reports
Schedule automatic report generation and delivery to stakeholders.
Fully Customizable Dashboards
Every dashboard can be tailored to your specific requirements. Add, remove, or rearrange widgets to create the perfect view for your business.
- Drag-and-drop widget arrangement
- Custom date range filters
- Multiple chart visualization options
- Export to PDF, Excel, or CSV
- Scheduled report delivery
- Role-based dashboard access
Ready to Transform Your Data into Insights?
Start using powerful dashboards and analytics to drive better business decisions today.